

When the Index Stops Telling the Whole Story
Financials are weakening, breadth is narrowing and stress is appearing in other parts of the market. None of these tells us what happens next, but together they’re worth understanding.
One of the biggest lessons I learnt studying the Global Financial Crisis had surprisingly little to do with predicting the stock market.
It was learning that the stock market, the economy and the financial system are three very different things.
We often talk about them as though they’re interchangeable. The S&P 500 is rising, therefore the economy must be strong. GDP is growing, therefore stocks should be doing well. Banks are falling, therefore something must be wrong with the economy. In reality, these relationships are considerably more complicated, and sometimes the differences between them are where the most interesting information can be found.
That lesson has stuck with me for years, and there’s a chart I’ve been looking at again recently that brought it straight back to mind.
Before We Jump In
We’re excited to be joining MyMoney Expo 2026 as an Official Education Partner.
Taking place in Sydney, MyMoney Expo brings together investors, industry experts and leading financial brands for practical education, insights and conversations across investing, trading and personal finance.
Come and meet the FXE Trading Academy team and hear from our featured speakers at the event.
Find out more and secure your ticket here.
We look forward to seeing you at MyMoney Expo 2026.
CHART 1: S&P 500 VS XLF PERFORMANCE, 2005-2009
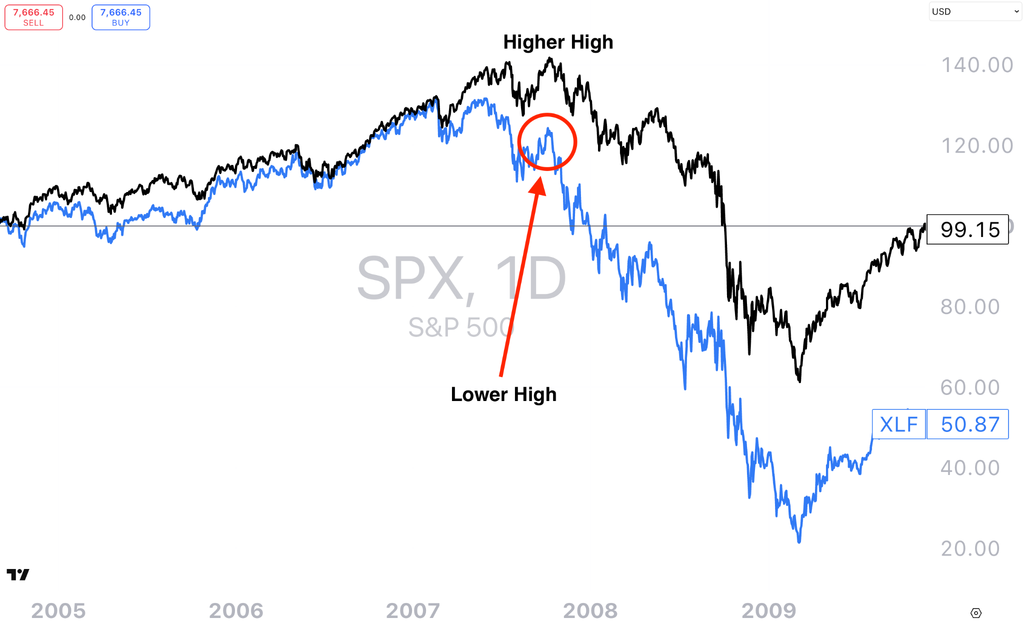
Caption: The S&P 500 vs XLF performance 2005-2009, for illustrative purposes only. Source: TradingView / fxevolution.com
The Chart I Remember From 2007
When I was studying the GFC, one thing I always remembered was what happened between financial stocks and the broader S&P 500 before the crisis became obvious.
Look at the chart below and something stands out. The broader market was still capable of pushing towards a new high in 2007, but financials weren’t confirming that strength. They had already begun behaving differently, with weaker relative price action and a lower high while the broader index was making a higher high.
With hindsight, we know what was developing underneath the surface. But that’s an important distinction: with hindsight.
I wouldn’t look at that chart and conclude that financial stocks somehow predicted the GFC. Markets don’t give us information that cleanly. What I took from it instead was that the financial system can sometimes begin behaving differently from the headline index before the implications are fully visible elsewhere.
And there is a logical reason financials are interesting.
Banks and other financial companies sit close to the plumbing of the economy. Credit creation, lending standards, funding costs, defaults, mortgages and business borrowing all run through the financial system in different ways. Changes in those conditions can eventually matter well beyond bank share prices, including for businesses, consumers and property markets.
That doesn’t make XLF a crystal ball. It makes it another piece of the puzzle.
CHART 2: PERCENTAGE OF STOCKS TRADING ABOVE THEIR 50-DAY MOVING AVERAGE
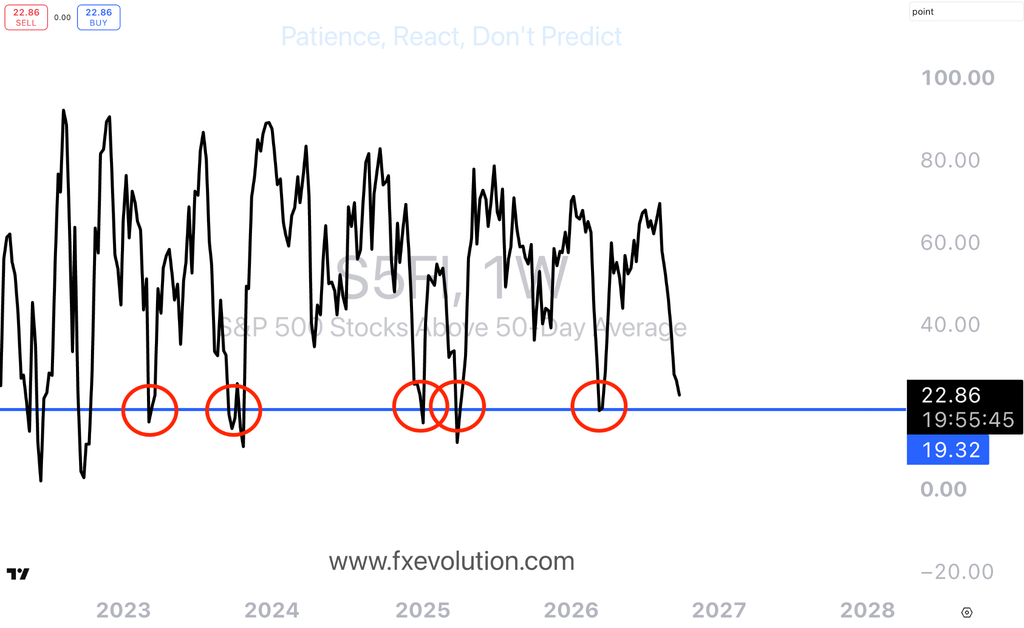
Caption: Percentage of stocks trading above their 50DMA has fallen drastically during the month of September. Source: TradingView / fxevolution.com
Which Brings Us to Today
I started looking at this again because something interesting has been happening beneath the S&P 500.
The headline index has held up reasonably well, but participation underneath it has weakened. During September, around 78% of S&P 500 constituents declined, despite the index itself falling only around 0.5%. Large technology companies have been doing a disproportionate amount of the heavy lifting, which means looking only at the headline index can give you a very different impression from looking at the individual stocks underneath it.
At the same time, financials have recently weakened relative to the broader market.
Again, I want to be careful with the interpretation. This doesn’t mean financials are telling us a major decline is coming. XLF itself is influenced by interest rates, the yield curve, earnings expectations, credit conditions and the composition of the sector. There can be plenty of reasons for it to underperform the S&P 500.
What interests me is the relationship.
And when I zoom the chart out, we’ve seen versions of this before.
We’ve Seen the Relationship Change Before
Take a look at the period leading into the 2022 market decline.
Financials began losing relative momentum in late 2021 while the broader S&P 500 was still holding up. That divergence didn’t tell us exactly when the market would turn, but with hindsight it became useful information about how participation underneath the index was changing.
We saw another version before the 2025 pullback and tariff uncertainty.
And now we’re seeing financials soften again while parts of large-cap technology continue to support the headline index.
CHART 3: S&P 500 VS XLF SECTOR PERFORMANCE, 2022-2026
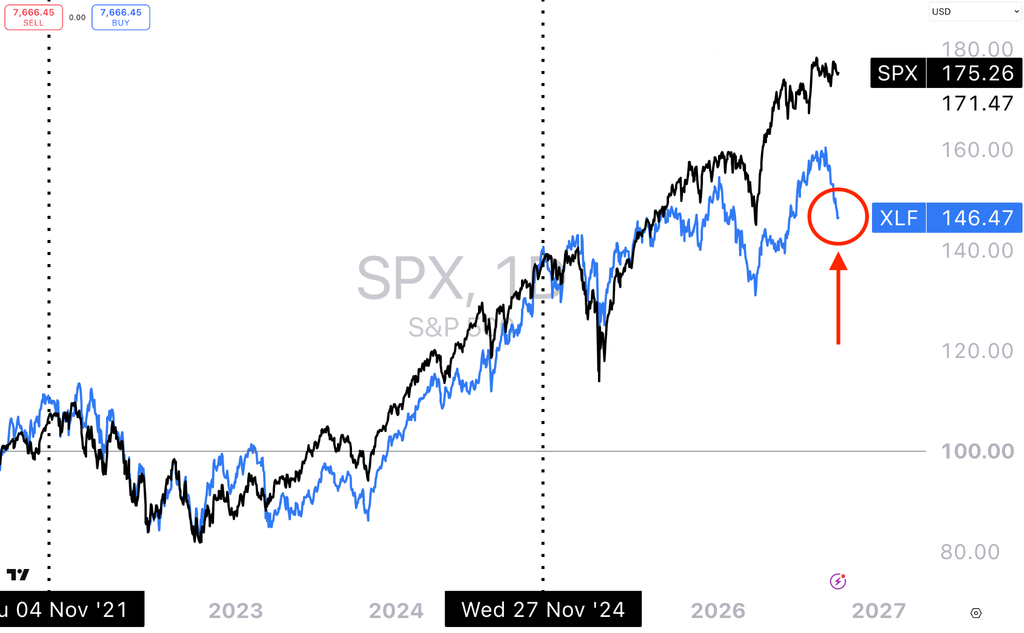
Caption: S&P 500 vs XLF sector 2022-2026. Source: TradingView / fxevolution.com
Three examples don’t create a law of markets, and I certainly wouldn’t treat this as a standalone signal. There have also been periods when financials underperformed without anything particularly dramatic happening to the broader market.
But this is where I think technical analysis becomes much more useful than simply drawing a line on a chart.
It’s about asking why the relationship might be changing.
Now Look Outside the Stock Market
This is probably the part I find most interesting at the moment, because financial stocks aren’t the only thing behaving differently.
The ICE BofA U.S. High Yield Option-Adjusted Spread has started widening. It moved from around 2.60% in late August to 3.12% by the end of September. That’s still nowhere near the sort of credit stress associated with genuine crisis periods, which is an important bit of context, but the direction has changed. Credit investors are asking for somewhat more compensation over Treasuries to own lower-quality corporate debt.
Bond volatility has also picked up. The MOVE Index, essentially a measure of expected volatility in the U.S. Treasury market, recently reached its highest level in almost six months and was more than 50% above its August levels.
Then there’s the U.S. dollar.
CHART 4: U.S. DOLLAR PERFORMANCE
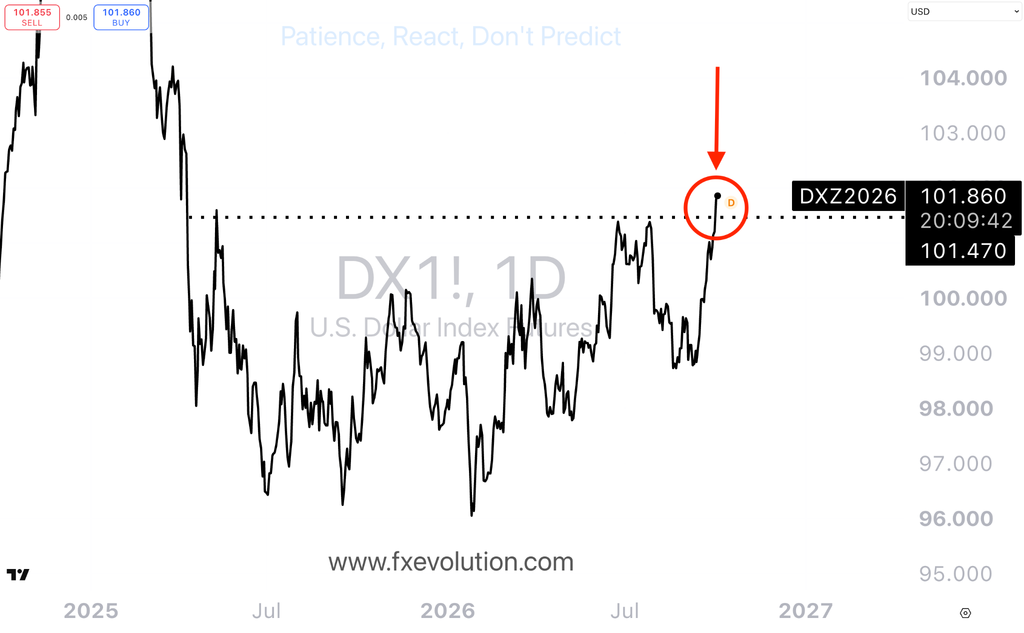
Caption: The U.S. dollar has just hit the highest level in 18 months. Source: TradingView / fxevolution.com
The dollar has just pushed to an 18-month high, alongside a significant move higher in U.S. yields.
Individually, I don’t think any of these observations tells us very much about exactly where the S&P 500 goes next. A strong dollar isn’t automatically bearish. Higher bond volatility doesn’t automatically mean stocks fall. Wider high-yield spreads don’t automatically mean a recession is coming, and weaker financials don’t automatically mean another GFC.
But put them together and they give us a more complete picture of the market environment than the S&P 500 alone.
That’s the lesson.
The Economy Isn’t the Stock Market
This takes me back to something that took me a long time to properly understand when I first started studying markets.
The economy isn’t the stock market, and the stock market isn’t the financial system.
They interact constantly, but they don’t have to move together.
A handful of enormous technology companies can support a market-cap-weighted index even while the majority of stocks underneath it are weakening. The economy can continue growing while credit conditions become less favourable. Financial stocks can weaken while the headline index remains strong. And changes in interest rates and credit availability can eventually have implications for areas such as business investment and property without immediately appearing in an equity index.
That’s why I spend so much time looking outside the S&P 500.
Breadth tells us how many stocks are participating. Financials give us another perspective on the companies closest to credit and lending. High-yield spreads tell us something about how credit risk is being priced. MOVE tells us about volatility in the enormous Treasury market. And the dollar gives us another view of global capital, rates and relative demand for U.S. assets.
What I’m Watching From Here
The part that interests me now isn’t whether we can find a historical chart that looks exactly like today. We almost always can if we look hard enough.
It’s whether these relationships continue or begin to change.
If financials regain relative strength, breadth improves and more stocks begin participating alongside the major technology companies, then the picture underneath the index would look different from the one we’re seeing today. Likewise, if credit spreads stabilise and bond volatility eases, that would give us another set of conditions to study.
If instead financials continue weakening, breadth remains narrow and measures of credit and bond-market volatility continue moving in the opposite direction to the headline equity index, then the divergence itself becomes increasingly interesting.
That’s probably the biggest lesson I took from studying 2007. The important part wasn’t learning that a lower high in financials predicts a financial crisis. It was learning not to assume that because the S&P 500 looks healthy, everything underneath it must be healthy as well.
Sometimes the index tells you the story.
Sometimes you have to look underneath it.
Make sure to check out our featured courses.
Until next week,
Patience. React, don’t predict.
Thomas Atkinson
CFTe | FXE Trading Academy
Trading financial products carries significant risk. The information provided is educational in nature and does not constitute financial advice. Past performance is not indicative of future results.
References
Please verify the exact source links and chart credits before publication.
Master the Markets
Free Live Trading Training Session