
When Markets Start Playing Defence
Something Interesting Is Happening Beneath the Surface of Wall Street
Something interesting is happening beneath the surface of Wall Street. And it reminds me of one of the first lessons I learnt about sector rotation.
I still remember when I first discovered sector rotation. I’d been studying charts for a while, but the idea that you could watch money shifting between different parts of Wall Street depending on the economic environment absolutely fascinated me.
You could look at seasonality, compare the performance of different sectors and sometimes notice that the market was changing before it became obvious in the major indices. What I found particularly interesting was how investors would sometimes start favouring healthcare, consumer staples and utilities when questions about the economy began appearing.
It completely changed the way I looked at markets. Instead of just watching whether the S&P 500 was rising or falling, I started paying more attention to which sectors were leading, which were falling behind and what that might tell us about investor behaviour.
Fast forward to 2026, and I’m starting to notice some interesting similarities.
Over the last few weeks, we’ve discussed the bond market quite a bit, particularly the widening spreads in CCC rated junk debt. These are some of the riskiest borrowers in the corporate bond market, and when investors begin demanding more compensation to lend to them, it’s worth paying attention.
What’s caught my attention more recently is that the movement isn’t just limited to CCC debt anymore. We’re now seeing broader high yield credit spreads moving higher as well, including the market represented by HYG.
Before we jump in, did you know you can register for our free live course training?
Master the Markets
Free Live Trading Training Session
CHART 1: HIGH YIELD JUNK BONDS, IEI VS SPY
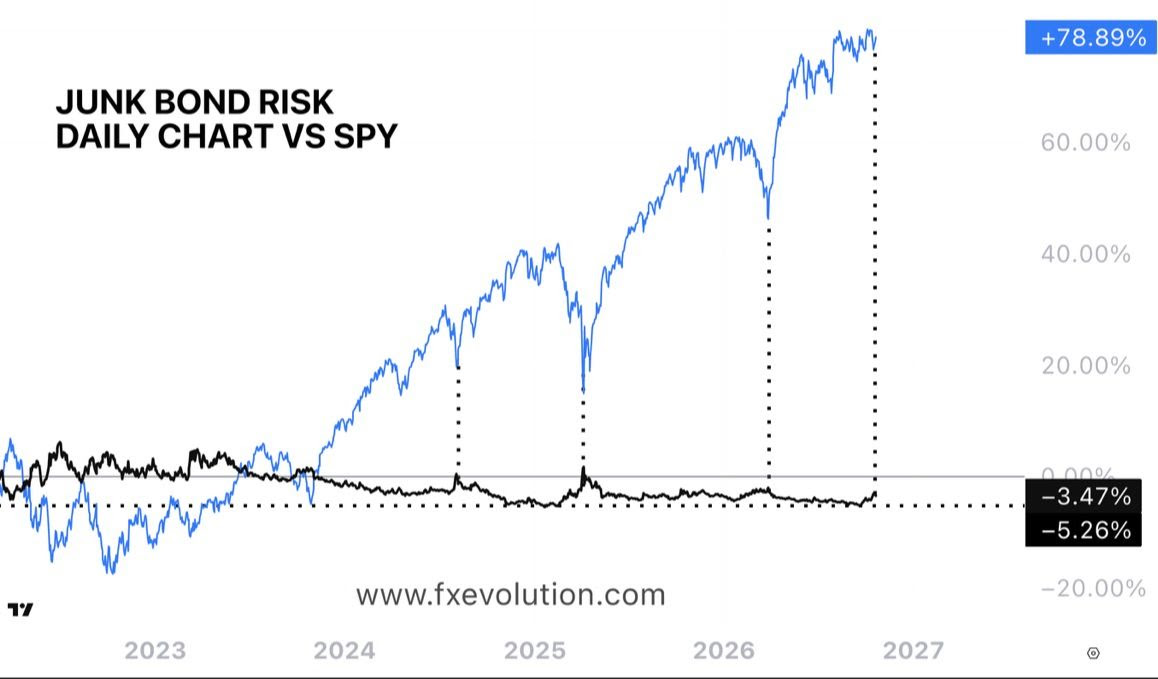
Caption: High Yield Junk Bonds / IEI vs SPY. Source: TradingView / fxevolution.com
The interesting part is that this has been happening while the S&P 500 has remained relatively resilient until this week. In other words, the bond market has been showing some changes in how risk is being priced, even though the broader stock market hasn’t experienced the same degree of movement.
I’ve always found these differences between markets fascinating. Sometimes credit moves first, sometimes equities do, and sometimes the relationship doesn’t develop into anything particularly meaningful. But it’s one of the reasons I like looking beyond the index itself.
And then there’s what’s been happening in semiconductors.
The Semiconductor Flows Are Hard to Ignore
This week alone we’ve seen some extraordinary transactions involving SOXL and SOXX, two ETFs linked to the semiconductor sector. Billions of dollars have been moving through these products, including one of the largest reported net inflow days for SOXX.
What makes it interesting is that all this activity has been appearing while semiconductor price action has remained under pressure.
CHART 2: SOXX NET INFLOWS
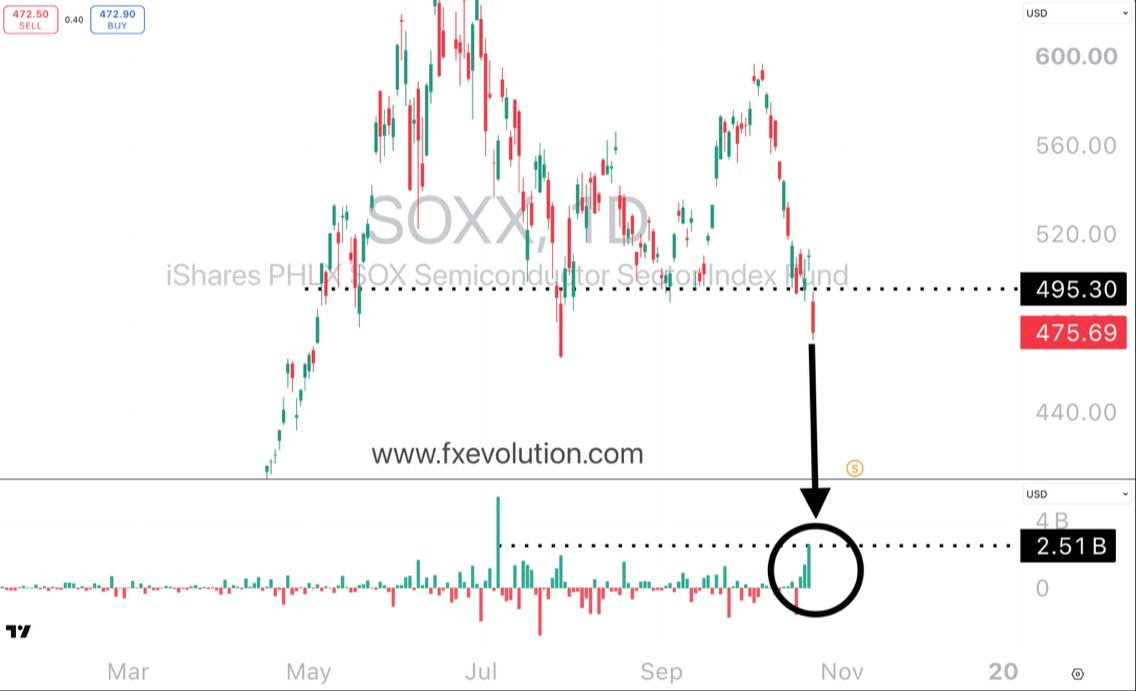
Caption: SOXX net inflows have only ever been bigger one other time during the sell off in July. Source: TradingView / fxevolution.com
When I first started studying institutional flows, I used to think a large transaction must tell us something fairly obvious about where prices were heading. But the more I studied them, the more I realised it wasn’t quite that simple.
You can have enormous amounts of activity in a sector while prices continue falling. Some investors might be positioning for a recovery, others could be adjusting exposures, and there can be all sorts of trading strategies taking place underneath the surface.
That’s why I prefer to put these transactions alongside the actual price chart. We can see the activity, but we also need to see how the market responds to it.
For now, the contrast between those large flows and the weakness in semiconductor prices is what interests me.
There’s also been something unusual happening in Europe.
For the first time in more than a decade, France’s 10 year government bond yield has moved above the U.S. 10 year Treasury yield. Considering the concerns surrounding French government finances and the way investors have historically priced these two bond markets, that’s quite a development.
CHART 3: FRENCH 10 YEAR GOVERNMENT BOND YIELD VERSUS U.S. 10 YEAR TREASURY YIELD
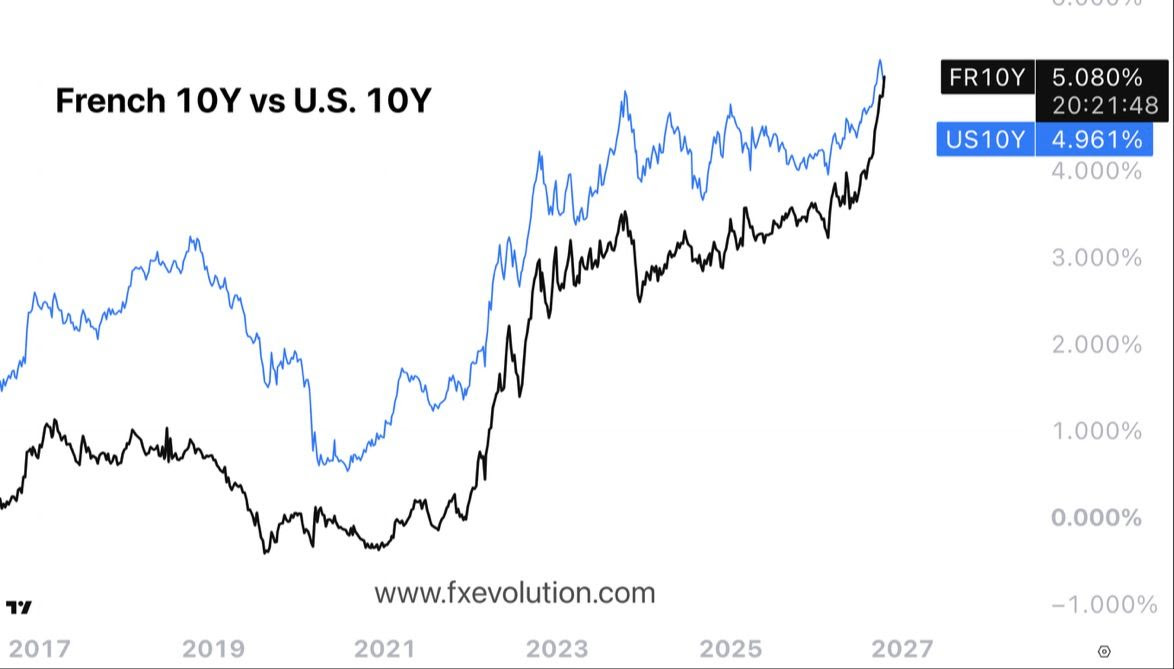
Caption: The French 10 year bond yield has overtaken the U.S. 10 year for the first time in over a decade. Source: TradingView / fxevolution.com
There’s obviously more going on here than simply which government investors trust more. But seeing that relationship change after so many years is another reminder of why I spend so much time watching bonds.
And it brings me back to something I learnt when I first started studying seasonality and sector rotation.
Is Wall Street Starting to Play Defence?
One of the things that surprised me early on was how differently sectors could behave when investors started questioning the economic outlook.
Technology might have been leading the market for months, but then you’d notice healthcare beginning to strengthen. Consumer staples would start outperforming, or utilities would begin showing relative strength. Sometimes the broader index barely moved, yet the sectors underneath it were telling a very different story.
That’s part of what we’re seeing again.
Over the past couple of weeks, healthcare through XLV, consumer staples through XLP and utilities through XLU have shown signs of improving relative strength, although not all three have moved higher over every period. At the same time, QQQ has been under considerably more pressure.
CHART 4: XLP, XLU AND XLV VERSUS QQQ
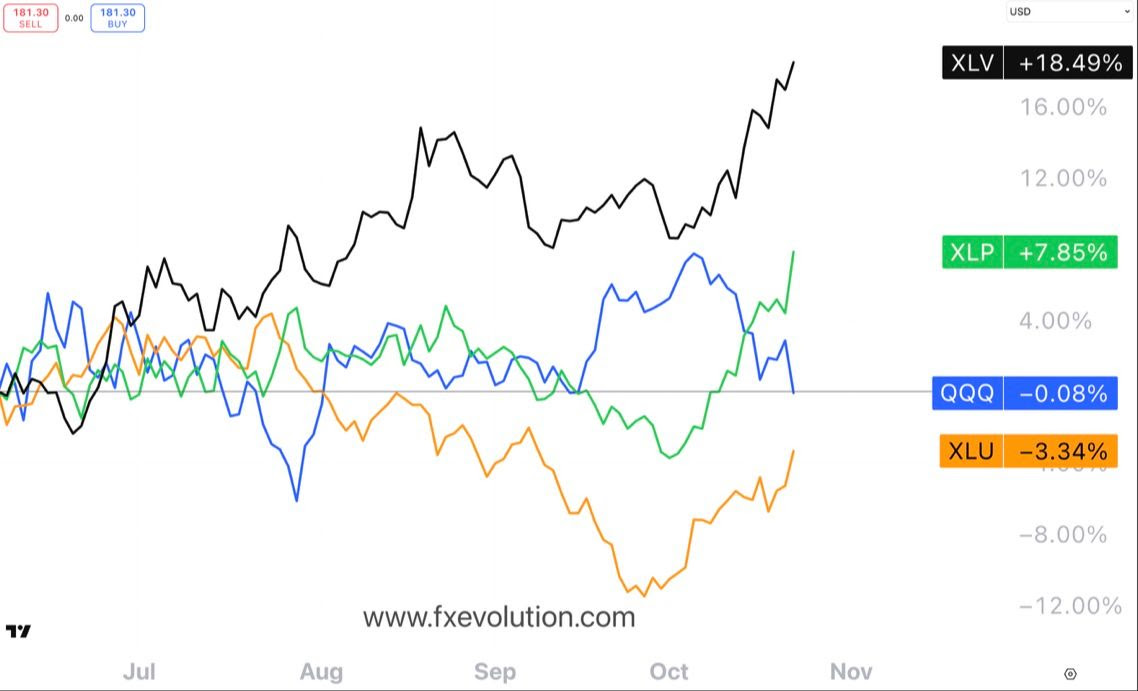
Caption: XLP, XLU and XLV are all seeing strong price action during October versus weakness in QQQ. Source: TradingView / fxevolution.com
I think this is one of the more interesting charts in the newsletter. It allows us to compare what the traditional defensive sectors have been doing against an index that’s heavily influenced by technology.
Of course, defensive sectors can outperform for several reasons. Seasonality, earnings expectations and interest rates all play a part. And sometimes outperformance simply means falling less than the rest of the market.
But that’s why I like studying the relationship rather than looking at each sector on its own.
If healthcare, staples and utilities continue gaining relative strength while technology struggles, it tells us something about how market leadership is changing. Whether that becomes a longer lasting trend is something we’ll have to watch.
The Lesson
One of the things I’ve learnt over the years is that the market doesn’t always give you an obvious signal that something is changing. Sometimes the S&P 500 is doing very little, yet underneath it, the behaviour of different sectors is starting to look quite different.
That’s what originally fascinated me about sector rotation. You could watch technology leading for months, then gradually see healthcare, staples or utilities begin attracting more attention. Sometimes it was seasonal, sometimes it reflected changing economic expectations, and sometimes it turned out to be nothing more than a temporary shift.
But I remember how much it changed the way I looked at markets. Instead of just asking whether the S&P 500 was going up or down, I started asking which parts of the market were actually doing the work.
And that’s the question I’m coming back to in 2026. With credit spreads widening, unusual activity in semiconductors and some defensive sectors starting to outperform, I’m interested to see whether this becomes a more sustained change in leadership or simply another short term rotation.
With earnings season upon us, the market will be asking even more questions. Stay agile.
Make sure to check out our featured courses.
Until next week,
Patience. React, don’t predict.
Thomas Atkinson
CFTe | FXE Trading Academy
Trading financial products carries significant risk. The information provided is educational in nature and does not constitute financial advice. Past performance is not indicative of future results.
Master the Markets
Free Live Trading Training Session