
What Bonds Taught Me About Stocks, Risk and the Signals Most Investors Overlook
I remember when I first started paying attention to the bond market. At the time, I was far more interested in stocks and currencies, and to be fair, bonds didn’t seem particularly exciting. I understood that central banks used interest rates to influence the economy, but I hadn’t really appreciated just how much the bond market influenced everything else.
What changed my thinking was discovering how many experienced investors were spending their time watching bonds before making sense of what was happening in stocks. Initially, I couldn’t quite understand why. But the more I looked into it, the more I realised that changes in borrowing costs, credit availability and government bond yields could tell us things that weren’t always obvious from an equity chart.
It taught me a lesson I’ve never really forgotten. Whenever I found myself dismissing a market because I didn’t think it was particularly important, there was a good chance I simply didn’t understand it well enough.
And that brings me to something I’ve been watching recently.
Before we jump in, did you know you can register for our free live course training?
Something Interesting Is Happening in Credit
CCC rated corporate bond spreads have been moving higher, and while that might not sound particularly exciting, I think it’s worth understanding what’s happening underneath the surface. These are some of the lowest quality borrowers in the corporate bond market, so when investors start demanding more compensation to lend to them, it tells us something about how risk is being priced.
The ICE BofA CCC and lower credit spread has moved from around 10.4 percentage points at the end of August to approximately 12.3 percentage points in early October. That’s a noticeable change in a relatively short period, particularly when you consider what we’re seeing elsewhere in the bond market.
CHART 1: ICE BOFA CCC BONDS VS ICE BOFA HIGH YIELD
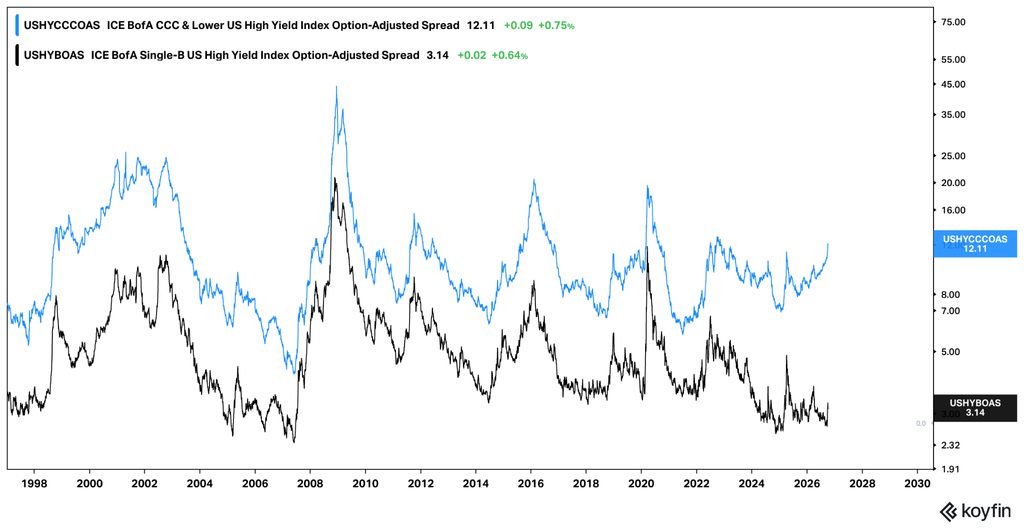
Caption: ICE BofA CCC bonds vs ICE BofA High Yield. Source: koyfin.com / fxevolution.com
I’ve also been comparing this with IEI against HYG, which gives us another perspective on how intermediate term U.S. Treasuries are performing relative to the broader high yield corporate bond market. What’s interesting is that this relationship has shown only relatively modest volatility compared with the movement in CCC spreads.
CHART 2: IEI / HYG WEEKLY CHART
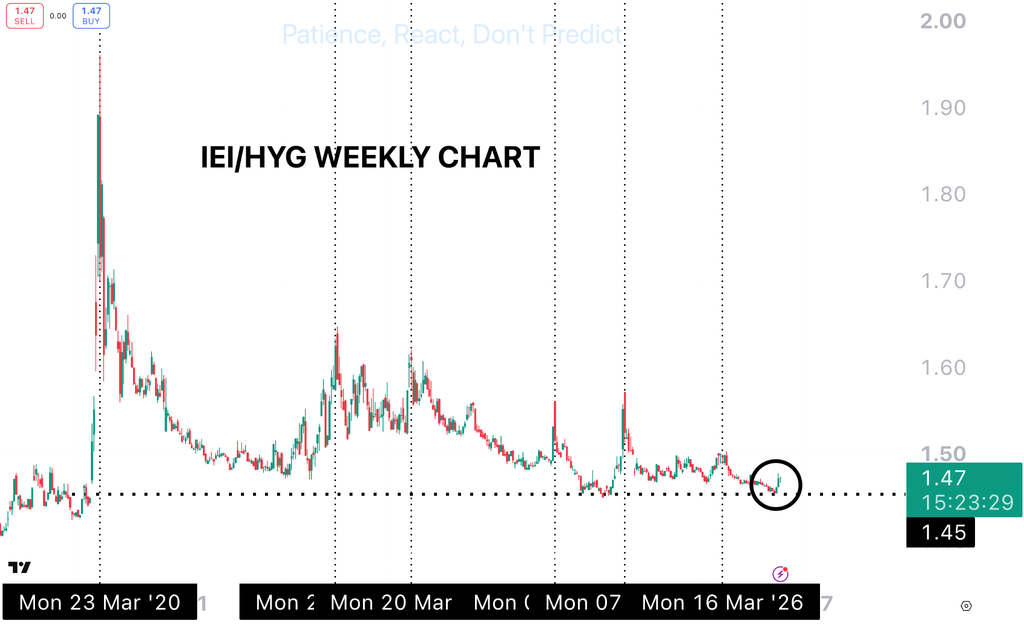
Caption: IEI/HYG shows that when we take away yield changes from bonds we are not seeing observable signs of extreme distress yet. Source: TradingView / fxevolution.com1
Now, these aren’t identical measures. The ETF ratio is influenced by interest rates and differences in duration, while CCC spreads are specifically measuring the additional compensation investors demand for credit risk. But that’s partly why I find the comparison interesting. We’re seeing a more noticeable change in how the riskiest borrowers are being priced, while the broader high yield relationship hasn’t moved nearly as much.
I’ve learnt over the years that these differences between markets are often worth paying attention to. Sometimes they amount to very little, and sometimes they become more meaningful as conditions develop. Either way, it’s a much more interesting exercise than looking at one chart and deciding everything is bullish or bearish.
And I think this week’s reaction in technology stocks provides a good example of why the cost of capital matters.
The AI Connection
We’ve spent a lot of time this year discussing the extraordinary amount of money being committed to AI infrastructure. Data centres, semiconductors, electricity, networking equipment and the financing required to build it all have become enormous parts of the investment story.
But this week we saw just how sensitive parts of the market have become to changes in that story. Reports around AI financing and future revenue expectations were followed by sharp moves in several technology companies, including Oracle.
What interests me here isn’t simply that a few technology stocks fell. It’s that investors appear to be paying closer attention to how some of this growth is being financed.
Think about it for a moment. A company can have enormous demand for its products, but if the cost of funding its expansion starts changing, the economics of that expansion can change as well. That doesn’t mean the technology isn’t valuable or that the demand disappears. It just means there’s another part of the equation worth understanding.
This takes me straight back to why I started studying bonds in the first place. I used to think of interest rates mainly in terms of central bank decisions. Eventually, I realised the market price of borrowing, and the willingness of investors to provide that money, could be just as interesting.
And we’re seeing some unusual developments in government bonds as well.
CHART 3: FRENCH 2 YEAR GOVERNMENT BOND YIELD
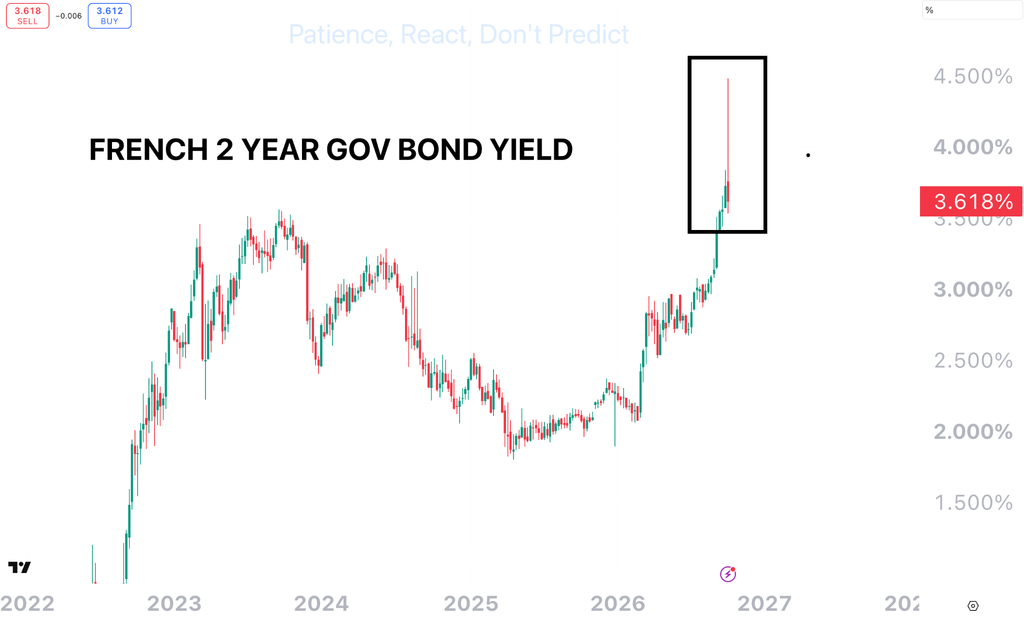
Caption: The French 2 Year Government Bond Yield Has Recently Been Very Volatile. Source: TradingView / fxevolution.com
When Corporate Bonds Yield Less Than Government Debt
One of the more unusual developments I’ve been watching is what’s happening in France. Government borrowing costs have been rising amid concerns about debt levels, ongoing budget deficits and political uncertainty.
But here’s the part that really caught my attention. Some highly rated corporate bonds are now trading at lower yields than comparable French government bonds.
Think about that for a moment. We’re generally taught that government bonds should offer a lower yield than corporate bonds because companies carry additional credit risk. Yet here we have examples where investors are accepting less yield from certain companies than from the French government.
That doesn’t necessarily make those companies safer than France. There are differences in liquidity, maturity, supply and the types of investors participating in each market. But it does show how much the pricing of government debt can change when investors become more concerned about public finances.
What I find particularly interesting is how far these developments can reach beyond the bond market. Government borrowing costs influence the rates used to price other forms of debt, and changes in those rates can eventually affect banks, businesses, households and property markets.
It’s something I never really appreciated when I first started studying markets. I used to think interest rates were mostly about central banks announcing a decision every few months. The more I studied bonds, the more I realised the market itself was constantly adjusting the price of money, often well before those changes became obvious elsewhere.
INSERT CHART 4: TLT WEEKLY CHART
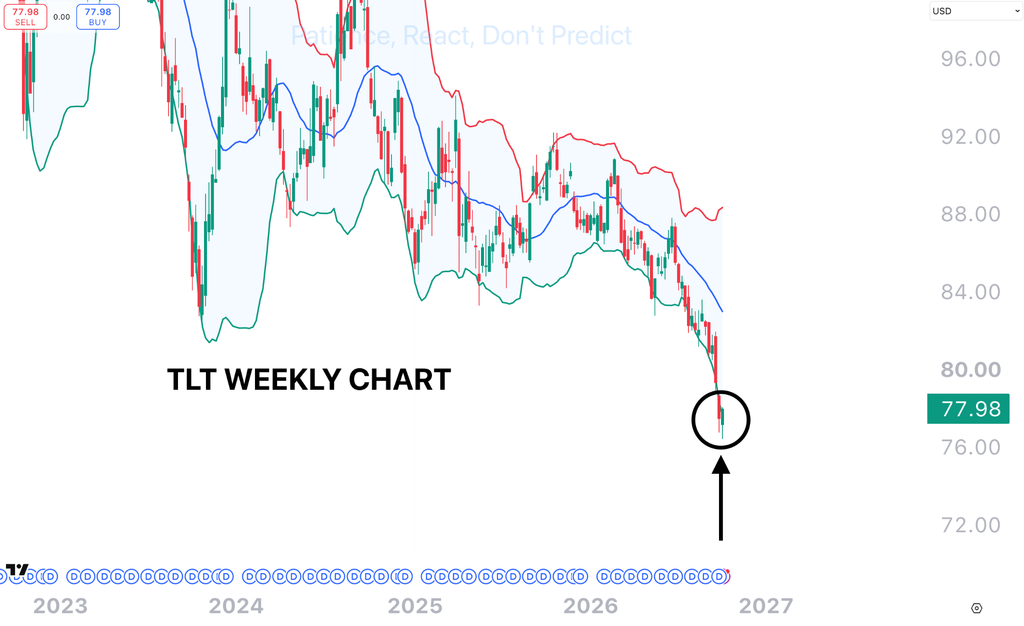
Caption: Treasuries are outside of their weekly Bollinger bands. Source: TradingView / fxevolution.com
TLT Was Stretched. Then Came Thursday’s Auction.
The other chart I’ve been watching closely is TLT, which tracks long duration U.S. Treasuries. On the weekly chart, price had moved outside its lower Bollinger Band after a considerable period of weakness. For anyone who follows our technical analysis, you’ll know these extended moves interest me, particularly when they occur on the higher time frames.
Then on Thursday, we saw something interesting. The U.S. Treasury held a $22 billion auction of 30 year bonds, and demand was particularly strong. The bid to cover ratio came in around 2.54, with indirect bidders accounting for approximately 72% of competitive purchases.
I thought the timing was worth paying attention to. Here we had TLT trading at an unusually extended level on the weekly chart, and almost immediately afterwards, a large Treasury auction attracted strong demand.
Now, there are plenty of reasons investors might have been interested in those bonds, particularly with long term yields at elevated levels. And one auction doesn’t establish a new trend. But this is exactly why I like combining technical analysis with market data. The chart showed us how far prices had moved relative to their recent range, while the auction gave us a look at demand for long term government debt at the yields available.
Neither observation tells the whole story, but together they give us something more useful to study than price alone.
The Lesson
Looking across these markets, what stands out to me is how differently investors are pricing risk. CCC credit spreads have been moving higher while the broader high yield market has shown relatively modest changes. In France, some highly rated corporate bonds are offering lower yields than comparable government debt, and in the U.S. we’ve just seen strong demand at a Treasury auction after a period of considerable weakness in long duration bonds.
I’m particularly interested in whether these relationships begin to change. Does the weakness in lower quality credit remain relatively contained, or do we start seeing similar moves elsewhere? And after that strong Treasury auction, does the behaviour of long duration bonds begin to look different? There are several possible outcomes, but following how these markets interact can help us better understand changes in financial conditions.
It reminds me of something I learnt years ago. When I first started studying bonds, I couldn’t understand why some of the most experienced people in markets spent so much time watching them. Eventually, I realised they weren’t ignoring stocks. They were looking at the cost of money, the availability of credit and the things that could influence what happened elsewhere.
I’ve never really forgotten that lesson. Whenever I catch myself thinking a market isn’t particularly important, it’s usually a good reason to spend more time understanding it.
Make sure to check out our featured courses.
Until next week,
Patience. React, don’t predict.
Thomas Atkinson
CFTe | FXE Trading Academy
Trading financial products carries significant risk. The information provided is educational in nature and does not constitute financial advice. Past performance is not indicative of future results.
Master the Markets
Free Live Trading Training Session